Quick Answer: Freight rates are rising in 2026 because two forces arrived at the same time. Federal enforcement (cabotage crackdown and English Language Proficiency rules) is permanently removing thousands of drivers and carriers from the market. Manufacturing demand, driven by data center construction and continued expansion, is pushing freight volumes up. The result: in June 2026, the national average dry van spot rate surpassed the contract rate for the first time since February 2022. DAT data shows spot rates up between 29% and 50% year-over-year across dry van, reefer, and flatbed. Uber Freight expects rates to run 20 to 25 percent above 2025 levels through the rest of the year. This is not a normal cycle. It is a structural repricing of trucking capacity, and small carriers who understand it will win it.
In this guide you’ll learn:
- The specific rate numbers and what they actually mean
- The historic June 2026 milestone that signals the turn
- The four forces driving the shift, with data behind each one
- Why this cycle is structurally different from previous freight recoveries
- What small carriers and owner-operators should do to capture the moment
- What could still reverse the trend
Where Rates Actually Stand in July 2026
The data has been clear for months now. What is new is that the market has crossed the threshold where the recovery becomes visible to everyone at once.
Spot rates (DAT Freight & Analytics, current levels ex-fuel surcharge):
- Dry van: $2.44 per mile
- Refrigerated: $2.80 per mile
- Flatbed: $2.95 per mile
Year-over-year rate changes (DAT, mid-2026):
- Dry van spot rates: up approximately 29% to 50%, depending on the reporting window
- Refrigerated: up approximately 21% to 40%
- Flatbed: up approximately 36% to 51%
US Bank Freight Payment Index (April to May 2026):
- Spot rates: up 31.29% year-over-year
- Contract rates: up 9% year-over-year
Cass Truckload Linehaul Index (June 2026): 149.4, which is 5.5 percent above year-ago levels despite a small monthly pullback that ACT Research characterized as “a temporary pause ahead of July 1 bid renewals rather than a reversal of the underlying rate upcycle.”
Tender rejections (June 2026): 17.55 percent, the highest since 2022. When rejection rates run this high, carriers are turning down contracted freight because the spot market pays better.
The direction is not ambiguous. The magnitude is unusual.
The Historic Milestone: Spot Rates Just Passed Contract Rates
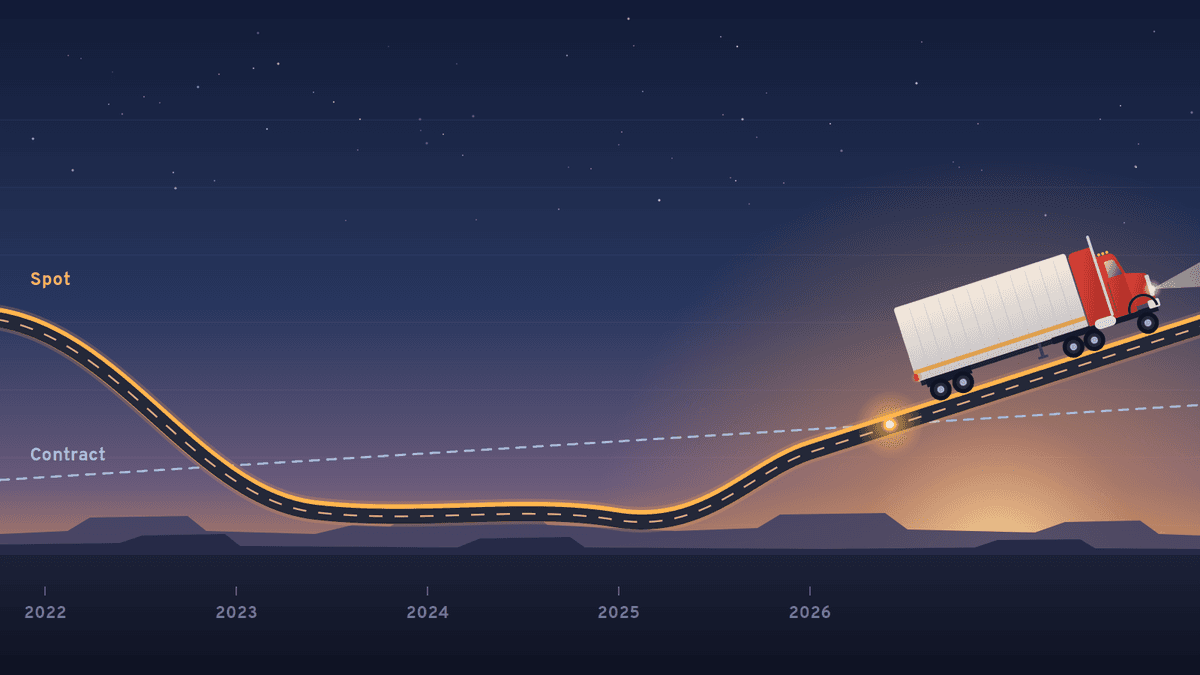
In June 2026, DAT reported a milestone the industry had been waiting for since the freight recession began. The national average dry van spot rate surpassed the contract rate for the first time since February 2022.
This matters because the relationship between spot and contract rates is the truest indicator of market direction. When contract rates run above spot rates, the market is in oversupply. Shippers have leverage. Carriers accept whatever comes. When spot rates rise above contract rates, the market has flipped. Carriers reject contracted freight to chase higher spot pay, and shippers scramble to hold their routing guides together.
The last time this crossover happened was February 2022. Everyone in trucking who lived through the 2022 rate spike knows what came next.
Reefer carriers are currently pointing to spot premiums of 19 cents per mile over contract. Van carriers are running 13 cents per mile above contract. Both premiums are widening.
Why This Is Happening: The Four Forces
Most freight cycles are driven by one side of the market at a time. Demand rises. Or capacity contracts. This cycle is different. Four forces are pushing rates higher at once, and the interaction is what makes 2026 unusual.
Force 1: Federal Enforcement Is Permanently Removing Capacity
The cabotage crackdown is the largest single capacity story of 2026. Since November 2025, the U.S. Department of Transportation and U.S. Customs and Border Protection have merged their enforcement systems. Roughly 3,200 Mexican B-1 visa holders have lost their U.S. entry authorization for cabotage violations, according to CANACAR data reported by FreightWaves and Overdrive.
Alongside cabotage, FMCSA’s updated border-zone guidance now allows out-of-service orders for English Language Proficiency violations, not just citations. FTR Transportation Intelligence estimates the ELP enforcement alone could remove approximately 25,000 drivers from U.S. roads annually if current trends continue.
Combined, these two enforcement actions are permanently pulling capacity out of the market that never returns. Not sidelining it. Removing it. For more on how this crackdown is playing out at the border and what it means for legitimate US carriers, see our 2026 cabotage crackdown analysis.
Force 2: Small and Regional Carriers Are Still Exiting
The freight recession that began in 2022 killed capacity slowly for four years. The recovery is not bringing that capacity back fast. It is culling what remains.
Mountain Valley Express, a regional LTL carrier operating 13 terminals across California, Arizona, and Nevada, ceased operations on July 7, 2026. Victory Freight Corp. and related businesses filed Chapter 7 bankruptcy earlier in the summer. Both were small enough that individual failures do not move national numbers, but the pattern is clear: DAT reports truck postings down 12 percent year-over-year while load postings are up 62.2 percent.
The carriers that survived the recession did so by cutting to the bone. Many of them are running with older equipment, older drivers, and no capacity to expand into the recovery. They are earning better rates, but they are not adding trucks.
Force 3: Insurance Pressure Is Squeezing the Survivors
Trucking insurance is having its own crisis in 2026. Sharply rising premiums and new insurability standards following a recent liability ruling are adding financial pressure on carriers already navigating elevated operating costs.
The pattern in previous freight cycles was that survivors of a downturn quickly grew as rates recovered. This cycle is different because insurance costs are rising faster than freight rates. A carrier that was marginally profitable at the bottom of the market now needs meaningfully better rates just to break even, because insurance costs have moved the goalposts.
The practical effect for the market: even carriers who survived cannot easily expand. Adding a truck means adding an insured driver, and both have gotten harder and more expensive.
Force 4: Manufacturing and Data Center Demand Is Rising
On the demand side, ISM’s Manufacturing PMI held at 53.3 in June, with new orders above 50 for six consecutive months. Manufacturing has been expanding, not contracting, and the driver has shifted.
The single largest new demand story in 2026 is data center construction. AI computing investment has translated directly into freight demand, particularly for construction materials, equipment, and specialty transportation. Arrive Logistics has noted that “the increase in freight demand correlates with investment in AI computing and data center construction,” and Trucking Dive has documented surging truck orders tied specifically to data center applications.
Add tariff-related freight pull-forward (shippers moving inventory ahead of policy deadlines), continued consumer spending, and an unusually early produce season, and demand is meaningfully stronger than it was a year ago, on top of a shrinking supply base.
What Makes This Cycle Different From Past Recoveries
Trucking has been through three or four rate cycles since the 2008 financial crisis. This one is different in three specific ways.
The capacity removal is structural, not cyclical. Previous cycles pulled capacity out of the market by killing marginal carriers who eventually came back. This cycle is removing capacity through federal enforcement. The 3,200 revoked B-1 visas and the ELP-related driver removals do not come back when rates rise. They are gone.
Demand and supply moved together. Most cycles have one dominant force. Either demand surges (2020 to 2021) or capacity crashes (2018). This cycle has both moving in the same direction at the same time. The result is a market where price discovery is unusually fast.
Insurance is now a structural cost, not a variable one. A carrier looking to add a truck in 2026 faces insurance costs that have risen faster than freight rates. That means the natural rebalancing mechanism (higher rates encourage more capacity) is broken. Rates can rise significantly before new capacity enters the market, because insurance is a permanent gate.
Uber Freight expects spot rates to run 20 to 25 percent above prior-year levels through the rest of 2026. That is not an outlier forecast. It is the mainstream expectation given the data.
What Small Carriers Should Do Now
Higher rates do not automatically produce higher margins. The carriers who win this environment are the ones who can act on it quickly and accurately. A practical checklist:
- Bid more aggressively in border-adjacent lanes. If you operate through the Southwest and Southeast, the rate environment is shifting hardest in your favor. Watch DAT and Truckstop benchmarks in those regions weekly.
- Renegotiate contract rates on schedule. With aggregate DAT contract rates up 9.8 percent year-over-year in May and spot rates now above contracts, contract renewals in Q3 and Q4 should reflect market reality. If your contract runs another six months at old rates, you are leaving money on the table.
- Track per-lane and per-truck profitability live. As rates move, the gap between a winning lane and a losing one widens quickly. Carriers who see margin in real time capture the rebalancing first. Carriers who wait for month-end close miss it. This is exactly what a connected TMS is for.
- Tighten your own compliance. The enforcement wave that is helping your rates is the same one that will hurt you if your paperwork is not clean. An expired medical card, a revoked ELD provider, or an unassigned drive-time backlog can put you out of service in an environment where being out of service costs more than ever. Our fleet compliance software keeps the record ready before the inspection.
- Build broker relationships now. When capacity tightens, brokers reach for carriers they already trust. A small fleet with documented performance is in a stronger negotiating position in this environment than it was a year ago.
- Reduce back-office friction so you can move faster. Every hour spent chasing PODs, matching IFTA receipts, or reconciling settlements is an hour you cannot spend evaluating better loads. Automating the back-office workflow becomes disproportionately valuable when rates are rising, because your time is worth more. See how TenTrucks handles the back office end to end for owner-operators, and the mid-size fleet version for 5 to 50 truck operations.
The carriers who are already running clean, connected operations are the ones capturing the rate rise as margin. The carriers still fragmented across five tools will see rates rise and margins stay flat, because their back office is eating the increase.
The Risks: What Could Reverse This
The forecast for continued rate strength through 2026 is well-supported, but the freight market does not run in straight lines. Three specific risks worth watching:
A demand shock. Persistent inflationary pressure, escalating conflict overseas, or a sharp consumer pullback could pull freight volumes down enough to loosen the market despite tight capacity. Manufacturing expansion has been steady, but consumer sentiment remains fragile.
A regulatory reversal. The cabotage and ELP enforcement is currently supported by both parties in Congress, but administrations change, priorities shift, and enforcement can slow. If federal action pulls back, some capacity comes back with it, though not all of it (visa revocations do not automatically restore).
Tariff policy changing again. Freight pull-forward ahead of tariff deadlines has boosted demand this year. When those deadlines pass without further disruption, the pull-forward reverses and freight volumes soften.
None of these is imminent as of July 2026. All three are worth watching quarterly.
Frequently Asked Questions
Why are freight rates rising in 2026? Freight rates are rising because federal enforcement (cabotage crackdown and English Language Proficiency rules) is permanently removing thousands of drivers and carriers from the market, while manufacturing and data center demand is pushing volumes up. The combination has produced the first environment since February 2022 in which spot rates exceed contract rates.
How much are freight rates up in 2026? Spot rates were up 31.29 percent year-over-year through May 2026 according to the US Bank Freight Payment Index. DAT reports dry van up 29 to 50 percent, reefer up 21 to 40 percent, and flatbed up 36 to 51 percent, depending on the reporting window. Contract rates are also up, but by a smaller margin (roughly 9 to 10 percent year-over-year).
When did spot rates surpass contract rates? The national average dry van spot rate surpassed the contract rate in June 2026. This was the first time that had happened since February 2022, more than four years earlier. The crossover is a strong indicator that the freight market has meaningfully turned.
How long will freight rates stay elevated? Uber Freight expects spot rates to run 20 to 25 percent above prior-year levels through the rest of 2026. Most industry analysts expect the upcycle to continue into 2027 as long as federal enforcement continues to remove capacity and manufacturing demand holds.
What is causing capacity to tighten in trucking? Four forces at once. Cabotage enforcement has revoked approximately 3,200 Mexican B-1 driver visas since November 2025. English Language Proficiency enforcement could remove another 25,000 drivers annually. Small and regional carrier failures continue. Sharply rising insurance costs are preventing surviving carriers from expanding.
Are trucking rates back to 2022 levels? Not fully, and probably not for a while. The 2022 rate spike was driven by extreme demand from post-pandemic supply chain disruption. The 2026 rise is driven more by capacity contraction than demand surge, so it is likely to be steadier and more sustained rather than a spike-and-crash pattern.
Why is trucking insurance so expensive in 2026? Sharply rising premiums following recent large liability rulings and tightening insurability standards from carriers. Insurance costs have risen faster than freight rates for most operators, which is preventing surviving carriers from expanding even as rates recover.
Which trucking segments are seeing the biggest rate increases? Flatbed has seen the largest percentage gains, up 36 to 51 percent year-over-year in various measures. Dry van has crossed the historic threshold of exceeding contract rates. Reefer sits between the two. Regional strength varies, with the Southwest and Southeast seeing the most visible tightening.
How does the cabotage crackdown affect US carriers? The cabotage crackdown removes foreign drivers who were often willing to accept below-market rates from the U.S. market. That reduces the rate undercutting that hurt legitimate US carriers during the recession, and it tightens border-adjacent capacity meaningfully.
What should small carriers do about rising rates? Bid more aggressively in tightening lanes, renegotiate contracts on schedule, track per-lane and per-truck profitability in real time, tighten compliance to avoid enforcement risk, and reduce back-office friction so you can act on opportunities quickly. Carriers who wait for month-end close miss the pricing signals happening weekly.
Are contract rates rising too? Yes, but more slowly than spot rates. Contract rates are up about 9 to 10 percent year-over-year, while spot rates are up 30 percent or more. That spread is why carriers are increasingly rejecting contracted freight to chase spot loads, which is driving tender rejections to their highest levels since 2022.
What could reverse the rate increases? A significant consumer pullback, a rollback of federal enforcement, or a large-scale tariff policy shift could each reduce demand or return capacity to the market. None of these looks imminent as of July 2026, but they are the risks worth watching in the coming quarters.
The Bottom Line
The freight recovery in 2026 is not a normal cyclical recovery. Federal enforcement has permanently removed capacity that will not return. Insurance pressure is preventing survivors from expanding. Demand is rising on data center construction and continued manufacturing expansion. The June milestone, spot rates crossing contract rates for the first time in four years, is the moment the market visibly turned.
For small carriers, this is the environment they have been waiting for since 2022. Higher rates do not automatically become higher margins, but for operations that can move quickly, price accurately, and keep their compliance clean, this is the moment to run the business at the top of its game.
Start your free trial of TenTrucks and see how live per-lane and per-truck margin, automated IFTA, connected dispatch, and clean compliance sit on one platform built for carriers who plan to capture what 2026 is offering.
For related context on the enforcement wave driving capacity out of the market, see our analyses of the 2026 cabotage crackdown, the BUILD America 250 Act, and IFTA reporting and ELD compliance in 2026. For the broader software picture, our guide to the 2026 trucking tech stack covers the systems small carriers need to run at the top of their game.
Sources and References
- DAT Freight & Analytics — Truckload Volume Index, spot and contract rate data (June and July 2026)
- US Bank Freight Payment Index — Q2 2026 rate data, spot vs contract analysis
- Cass Information Systems — Cass Truckload Linehaul Index (June 2026)
- Uber Freight — Q2 2026 Market Update and Outlook Report
- FTR Transportation Intelligence — English Language Proficiency enforcement estimates, market direction analysis
- FreightWaves — SONAR data, cabotage enforcement reporting, market analysis
- Truckstop.com — Weekly spot rate data (through July 2026)
- Institute for Supply Management (ISM) — Manufacturing PMI data (June 2026)
- Bureau of Transportation Statistics (BTS) — Transportation services PPI
- Arrive Logistics — July 2026 Freight Market Update
- Trucking Dive — Data center freight demand reporting
- U.S. Customs and Border Protection (CBP) — Cabotage enforcement actions
- ACT Research — Market direction commentary
Rate and volume figures reflect published data through late July 2026. Freight markets change quickly. Verify against current data before making pricing decisions. This article is informational.
About TenTrucks
TenTrucks is an AI-powered fleet operations platform for owner-operators and carriers running 1 to 50 trucks. It combines TMS and dispatch, ELD and compliance, automated IFTA reporting, settlements, invoicing, and a mobile driver app in one system, so carriers can see live per-lane and per-truck margins as market conditions shift.
Disclaimer: This article provides market analysis based on published data and industry reporting. It is not investment, business, or legal advice. Consult qualified professionals for decisions affecting your operation.